Plot
- class floulib.Plot
Bases:
objectThis class contains methods to plot various object.
- ax = None
The Axes of the subplot.
- plot(nrows=1, ncols=1, **kwargs)
Generic plot method
- Parameters:
nrows (int, optional) – Number of rows of the plot. The default is 1.
ncols (int, optional) – Number of columns of the plot. The default is 1.
**kwargs –
- For
Discrete: index: index of the plot. The default is 0.
xlim: x-limit for the plot. The default is None.
ylim: y-limit for the plot. The default is [0, 1.05].
coeff: coefficient used for scatter plot. The default is 0.25.
scatter: if True scatter plot is used otherwise conventional plot is used. Default is True.
any keyword argument accepted by matplotlib.scatter if scatter is True or by matplotlib.plot otherwise.
- For
- For
Multilinear: index: index of the plot. The default is 0.
xlim: x-limit for the plot. The default is None.
ylim: y-limit for the plot. The default is [0, 1.05].
vlines: if True, dashed vertical lines are plotted for each point. Default is False.
any keyword argument accepted by matplotlib.plot.
- For
- For
RuleorRules: xlim: x-limit for the plot. The default is None.
ylim: y-limit for the plot. The default is None.
implication: if True, an implicative view of the rule is considered for plotting the support, otherwise conjunctive view is considered. Default is False.
any keyword argument accepted by shapely.plotting.plot_polygon.
- For
- For
Smiley: index: index of the plot. The default is 0.
- For
- For
Variable: index: index of the plot. The default is 0.
any keyword argument accepted by the type of the variable.
- For
- Returns:
The plot.
- Return type:
- add_plot(other=None, **kwargs)
Adds a plot to a plot.
- Parameters:
- Raises:
Exception – Raised if the parmeter other is not provided.
- Returns:
The plot.
- Return type:
Example
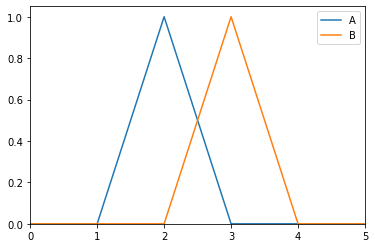
>>> from floulib import Discrete, Triangle
>>> A = Triangle( 1, 2, 3, label = 'A')
>>> B = Triangle(2, 3, 4, label = 'B')
>>> A.plot(xlim = [0, 5]).add_plot(B)
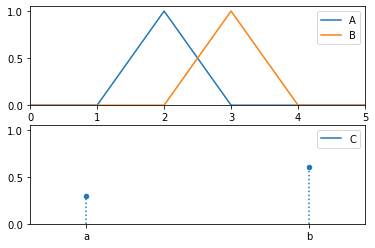
>>> C = Discrete(('a', 0.3), ('b', 0.6), label = 'C')
>>> A.plot(nrows = 2, xlim = [0, 5]).add_plot(B).add_plot(C, index = 1)
- color(color)
Sets the color of the plot.
- Parameters:
color (matplotlib.colors) – The color.
- Returns:
The multilinear fuzzy subset.
- Return type:
Example
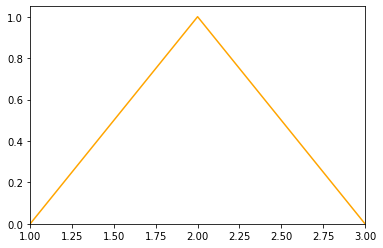
>>> from floulib import Triangle
>>> A = Triangle( 1, 2, 3)
>>> A.color('orange').plot()
- label(label)
Sets the label associated with the plot.
- Parameters:
label (str) – The label.
- Returns:
The plot object.
- Return type:
Example
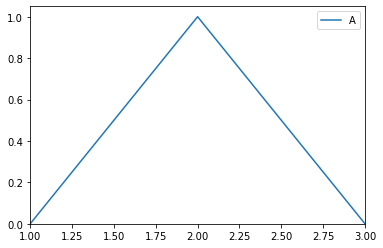
>>> from floulib import Triangle
>>> A = Triangle( 1, 2, 3)
>>> A.label('A').plot()
- legend(index=0)
Builds the legend.
- Parameters:
index (int) – index of the plot. The default is 0.